Scheduling, Logging, and Visualizing SpeedTest Data
It’s all well and good to go to https://www.speedtest.net/ and run a SpeedTest. But, that’s just one server at one point in time.
This project has two parts and is intended to track bandwidth speed over time by repeatedly running a speed test and then visualizing the results. This is useful to get a read on what a specific device’s actual download and upload speeds are and how much they fluctuate.
There are two parts to this:
run-speedtest.R– a script that can be scheduled to run on any schedule and record the results of the speed tests (upload and download) to a Google Sheetvisualize-speedtest.Rmd(RNotebook) and/orvisualize-speedtest-flex.Rmd– an RNotebook and/or a Shiny app that will read the results from that Google Sheet and provide plots of the recorded bandwidth over time.
The source code for these components is available on Github. In this post, we’ll walk through the code to actually run the speed test (run-speedtest.R) and will then simply show examples of the results of the Shiny app:
Requirements
In addition to the packages used (as commented in the run-speedtest.R file, they are not all on CRAN as of this writing), a Google Sheet needs to be created with two tabs:
- Download Data – this is where the results of the download speed tests will be stored and read
- Upload Data – this is where the results of the upload speed tests will be stored and read
The ID for that Google Sheet will need to be recorded (see the googlesheets4 documentation for details). The “visualize” notebook and Shiny app assume that the Google Sheet has been made public (view only / available to anyone with the link) because, well, this seems like particularly non-sensitive data, and it makes for being able to read the data without having to jump through any auth hoops.
Because it’s horrible form to store such an ID in public code, both of the files above read that value from an environment variable called SPEEDTEST_GSHEET.
You can create the same variable by opening your .Renviron file and adding a line to it:
SPEEDTEST_GSHEET = "[the ID for your Google Sheet]"
Running the SpeedTest
The code to run the speed tests pulled heavily from the base material posted at https://github.com/hrbrmstr/speedtest.
The speedtest package is not on CRAN, and googlesheets4 version v0.2.0.9000 or later is needed, so these packages may need to be installed from Github.
devtools::install_github("hrbrmstr/speedtest")
devtools::install_github("tidyverse/googlesheets4")
Once that’s done, load a few libraries and configure the Google Sheets ID (see note above), how many servers to run on, and whether you want the “smaller Google Sheet” (fewer columns; mostly just the columns being used later for the visualizations, but those visualizations have to download the data from Google Sheets, so it’s more of a bandwidth issue, ironically, than a storage issue):
library(speedtest)
library(tidyverse)
library(googlesheets4)

gsheet <- Sys.getenv("SPEEDTEST_GSHEET")

# Set the number of servers to run on. There will be 10 tests per server run for the download tests
# and 6 tests per server run for the upload tests.
num_servers = 3

# Set whether you want to store *all* of the data returned for the test or just as subset of columns
# that will be used for subsequent visualization (and a couple extra).
smaller_file <- TRUE
Determine which servers to run the tests with.
# Get the client configuration for the test
config <- spd_config()

# Get a a list of SpeedTest servers and then the num_servers "best" ones from that list.
servers <- spd_servers(config=config)
best_servers <- spd_best_servers(servers = servers, config = config, max = num_servers)
Run the tests and compile the results in a couple of data frames: one for download speeds and one for upload speeds.
# Run the upload and download tests on each of those servers. The test will run 10 tests on
# a single server at a time.
upload_test <- best_servers %>%
  rowwise() %>%
  do(spd_upload_test(as_tibble(.), config, summarise = FALSE) %>%
       mutate(test_time = Sys.time())
  ) %>%
  ungroup()

download_test <- best_servers %>%
  rowwise() %>%
  do(spd_download_test(as_tibble(.), config, summarise = FALSE) %>%
       mutate(test_time = Sys.time())
  ) %>%
  ungroup()

# Add a timestamp for when the tests were run
download_test <- download_test %>% mutate(test_time = Sys.time())
upload_test <- upload_test %>% mutate(test_time = Sys.time())

# Select the smaller number of columns if smaller_file is set to true.
if(smaller_file == TRUE){
  download_test <- download_test %>%
    select(host, test, secs, size, bw, test_time)
  upload_test <- upload_test %>%
    select(host, test, secs, size, bw, test_time)
}
Add the data to the Google Sheets.
# Eventually, this should be updated to use error checking to determine if the sheet
# exists AND if there is any data in each one. But, for now, it's counting on a clean setup.
download_data_check <- read_sheet(gsheet, "Download Data")
upload_data_check <- read_sheet(gsheet, "Upload Data")
# If this is the first time to add data, then write the data (which will include the columns).;
# Otherwise, just append the new data to what is already there.
if(nrow(download_data_check) == 0){
sheet_write(gsheet, download_test, "Download Data")
} else {
sheet_append(gsheet, download_test, "Download Data")
}
if(nrow(upload_data_check) == 0){
sheet_write(gsheet, upload_test, "Upload Data")
} else {
sheet_append(gsheet, upload_test, "Upload Data")
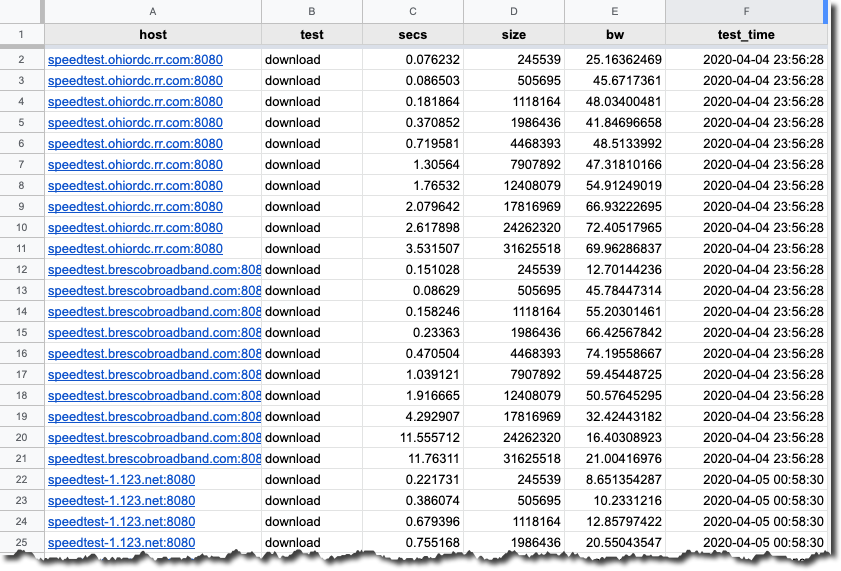
}Running the script, if all goes well, will populate the Google Sheet with something like the following:
Scheduling the Tests to Run
Once run-speedtest.R is configured and working, it can be scheduled using the cronR package on the Mac or using Task Scheduler on Windows. The schedule can be set up for any frequency. I set it up for hourly, but it could be daily or weekly or even be changed over time.
This does wind up building a data set stored in Google Sheets that grows indefinitely over time. The larger the Google Sheet, the longer it takes the RNotebook to run or the Shiny app to load. There are two settings in run-speedtest.R to limit the growth of this data:
num_servers– this controls how many tests are run; technically, it controls how many different servers the standard set of SpeedTest tests get run on. If you just run SpeedTest from speedtest.net, the system picks the “best” server and just runs the test on that. This script lets you specify how many servers to run the tests on just to get a broader read on your device’s bandwidth.smaller_file– this is a simple TRUE/FALSE. If this is set toTRUE, then the script removes a number of columns from the SpeedTest data before pushing the results to the Google Sheet. This cuts the size of the dataset by ~2/3.
Output - RNotebook
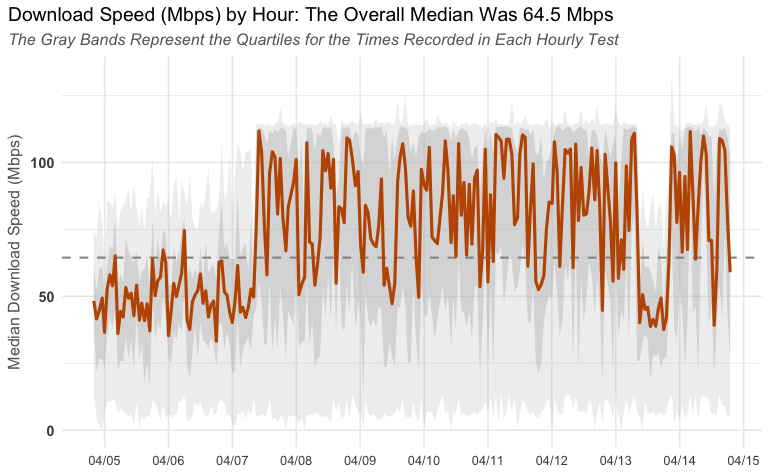
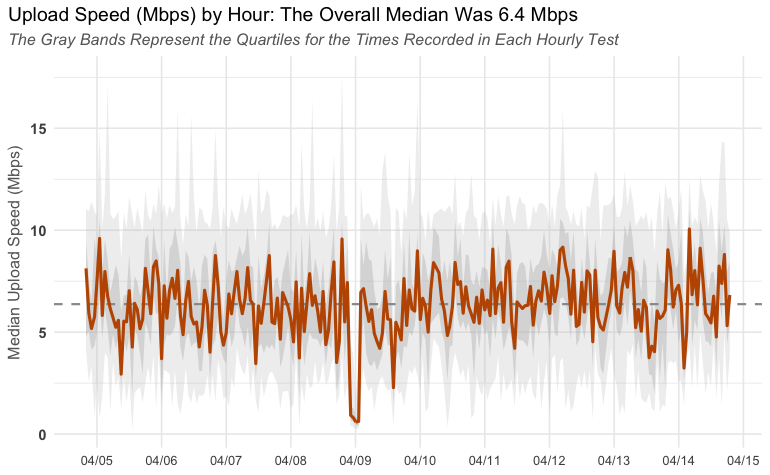
The output of the visualize-speedtest.Rmd file will include both time-series charts and histograms of the recorded data.
The time-series plots look something like the following:
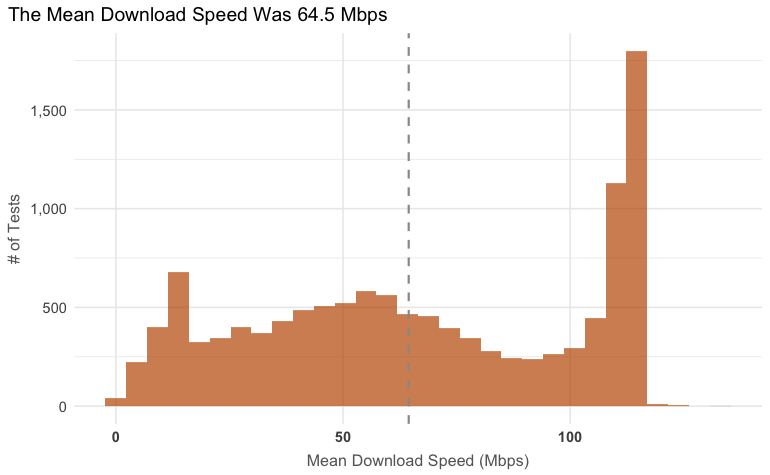
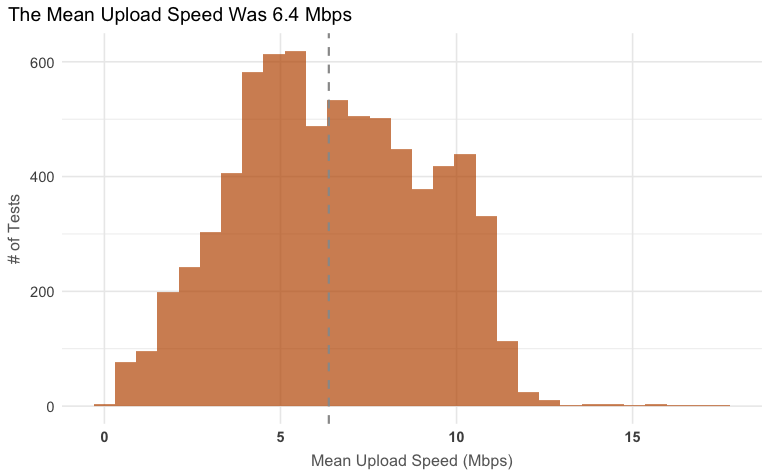
The histograms look something like the following:
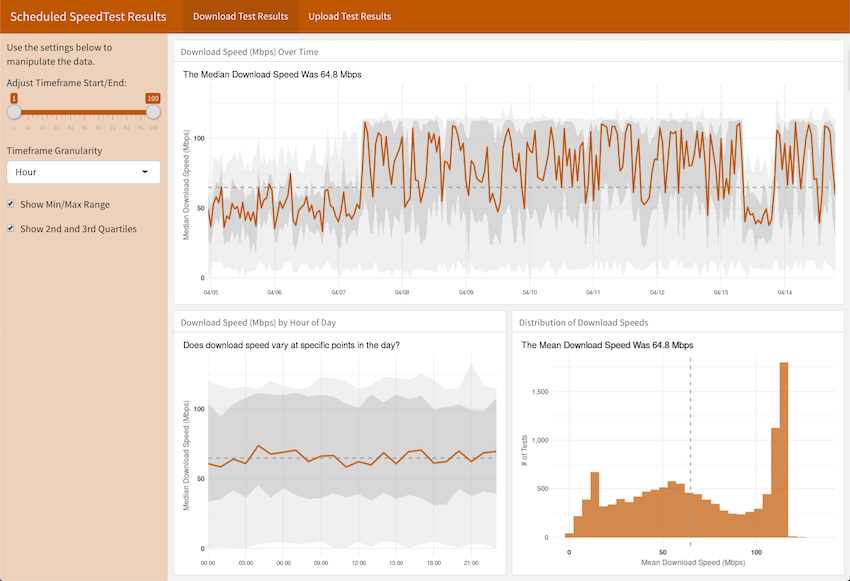
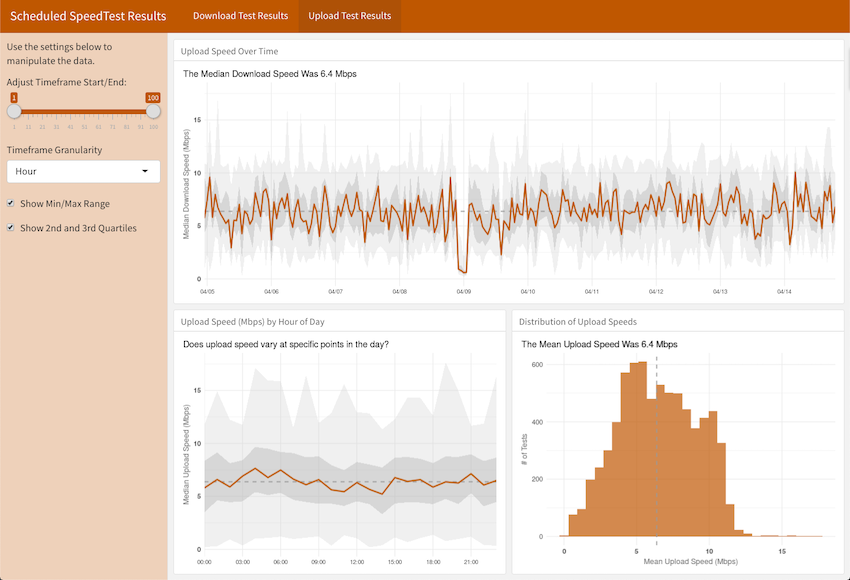
Output - Shiny
The Shiny app is more interactive and allows subsetting the data using a simple slider. And, it supports some simple adjustments to the visualization: turning on/off the quartile bands.
It also includes a plot by hour-of-day (my son theorized that bandwidth may vary based on peak usage times, similar to electricity).
Source Code
The source code for both running the SpeedTest, as well as analyzing the results via an RNotebook or a Shiny app are available on Github.