Analytics, Statistics, Inference, and the Evidence Ladder
“Statistics” is a tricky word. Subtract a letter or add one of several modifiers, and the meaning of the term (or phrase) changes. And yet, these different meanings are related to each other. There is value in trying to get some clarity as to these differences, as they get muddled together in the minds and behaviors of many analysts and marketers in ways that lead to dangerously misaligned expectations when it comes to what “the data” can deliver in different scenarios.
Consider:
- Statistic
- Statistics
- Inferential Statistics
- Causal Inference (I know…this doesn’t have “statistics,” but chain it to the “inferential” bit above and we’re in the same family of confusion)
(Warning: these terms quickly branch out to include quasi-experiments, counterfactuals, natural experiments, randomized controlled trials, A/B testing, field experiments, matched market experiments, and more!)
A colleague recently shared a post from Shopify that included a diagram showing the “levels of evidence ladder for causal inference methods,” which the authors had derived (visually the same…but with altered “rungs” on the ladder) from an nc233 post.
I’m not going to include either diagram here…because I don’t quite follow (agree with?1) some of the ways both posts split up the rungs of the ladder.
A Three-Level Evidence Ladder
Here’s the TL;DR:2
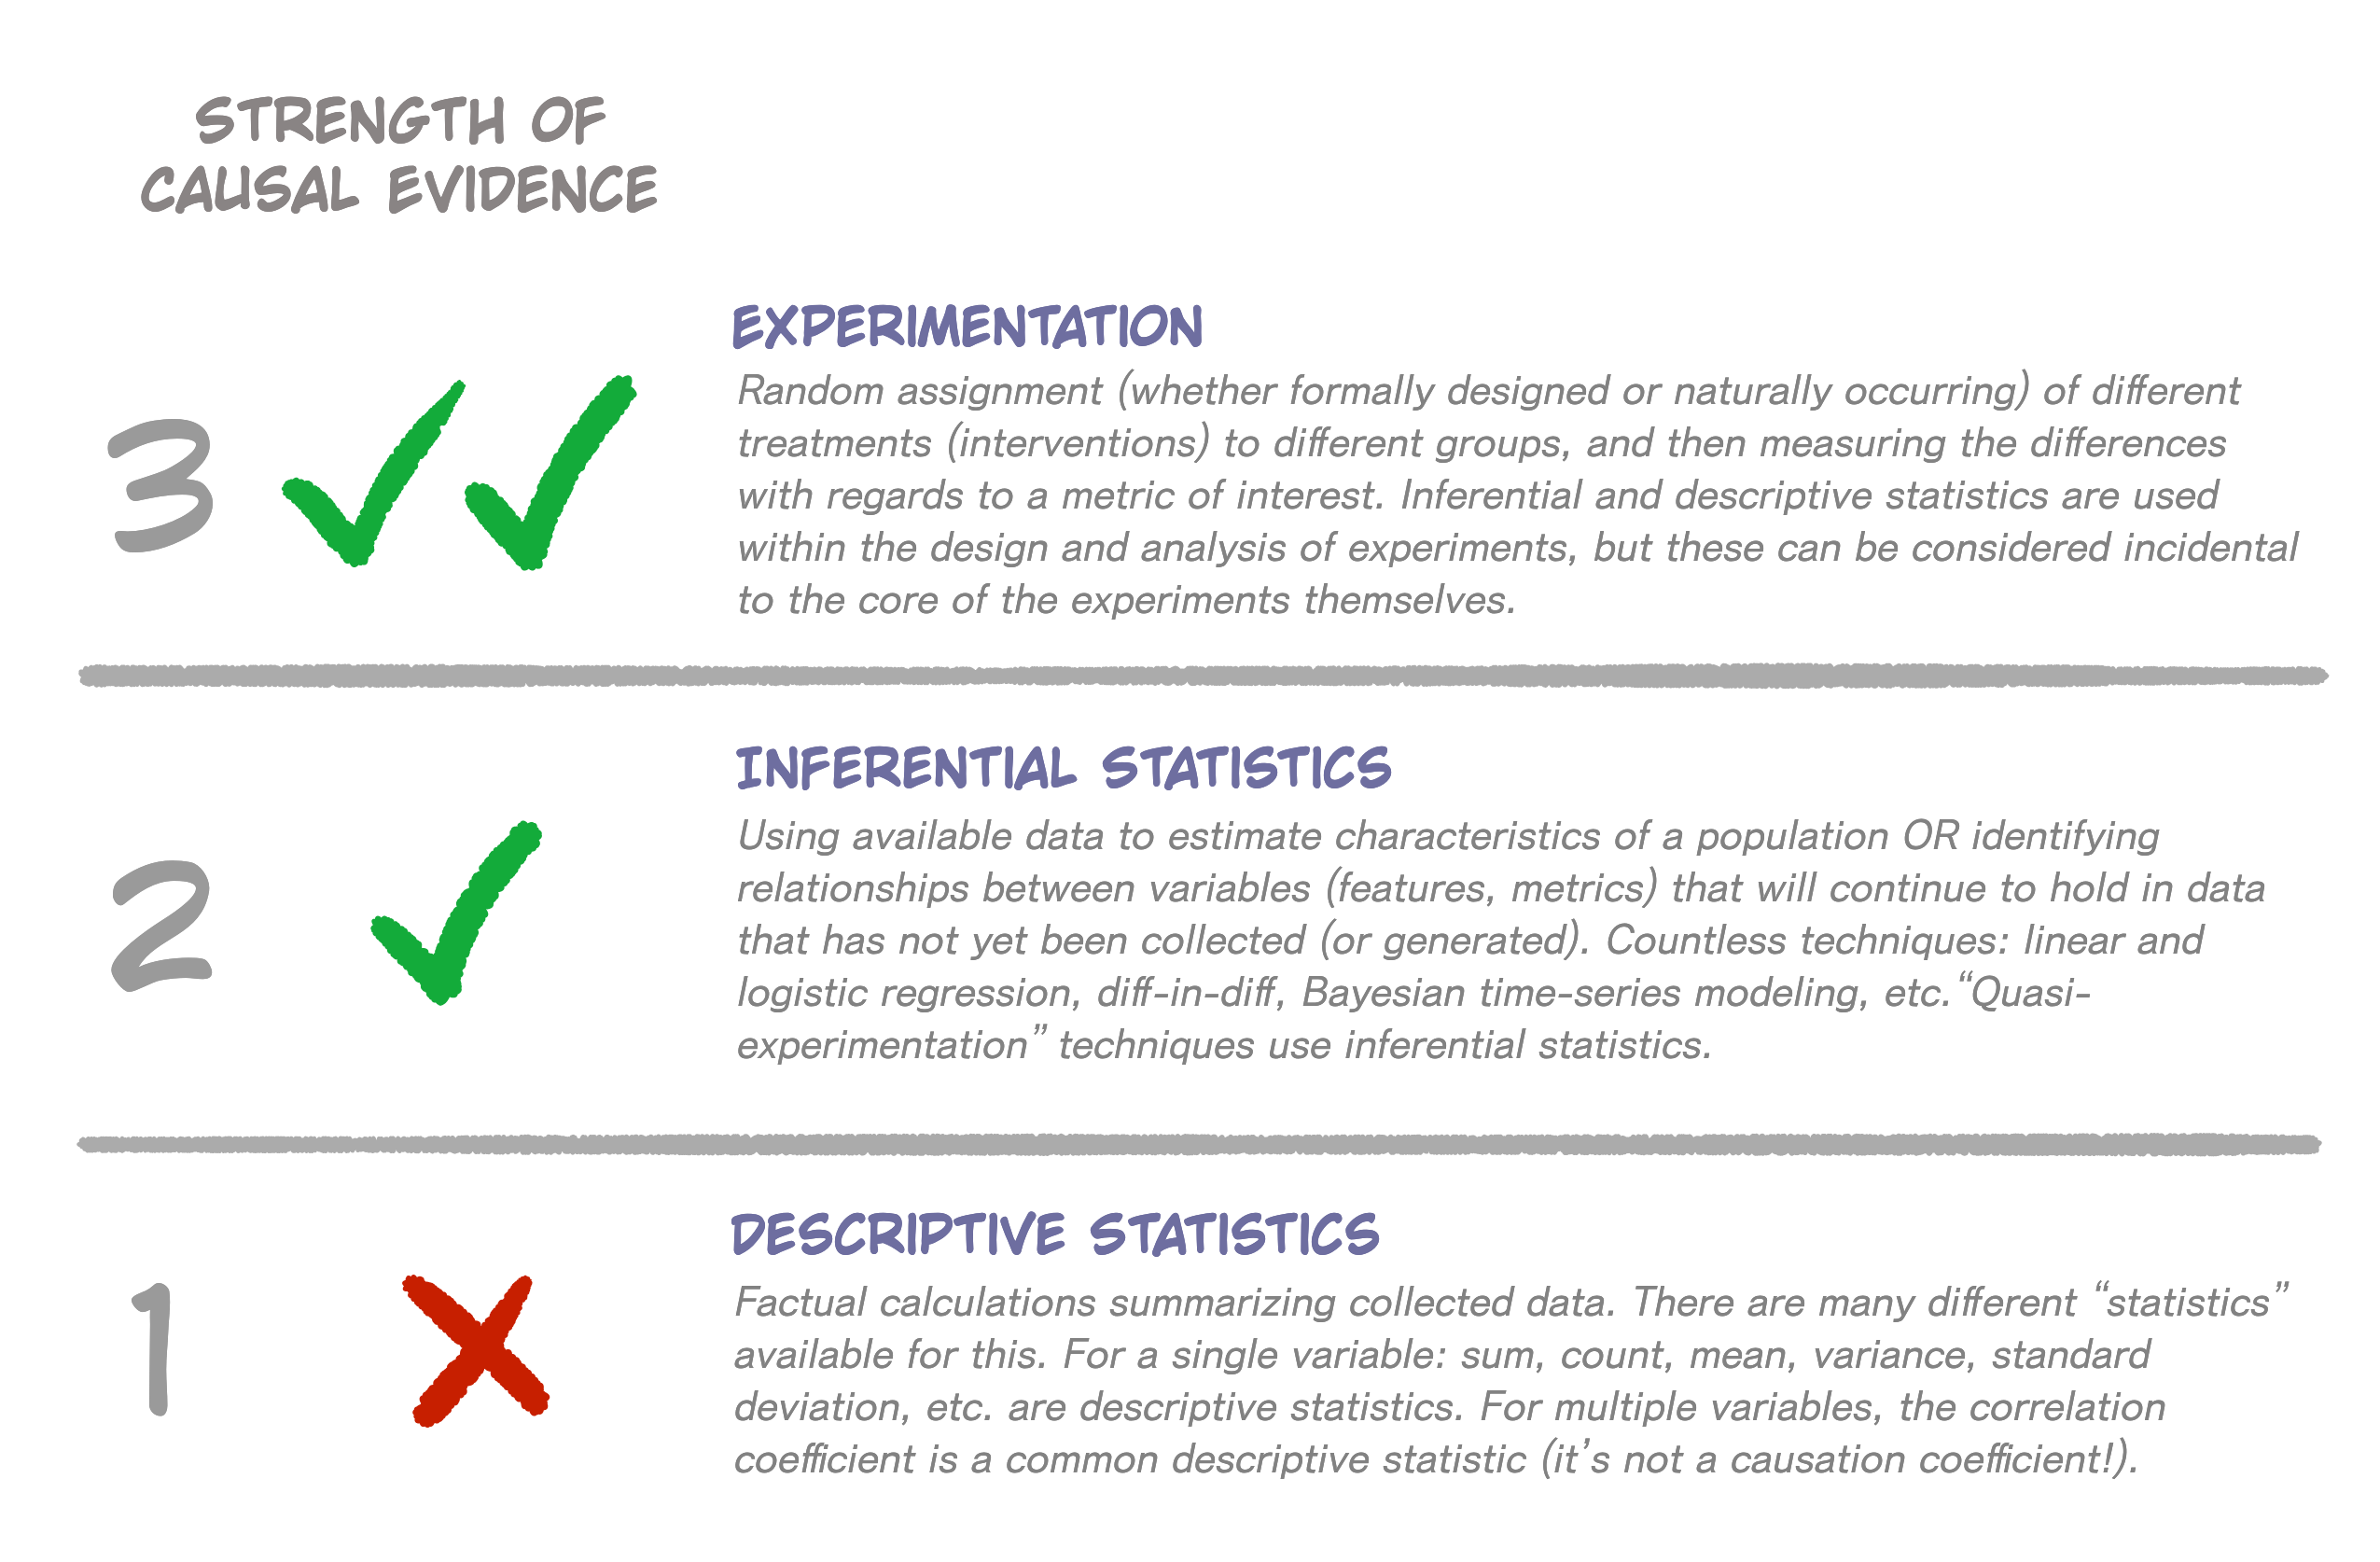
- A statistic is descriptive and (reasonably) deterministic. It is factual information about a data set.
- Inferential statistics are about making predictions about a population from a sample of observations from that population and about describing relationships between different characteristics within a data set. This is where things get messy.
- Causal inference is about describing the impact that one (or multiple) factors have (or will have) on something else. Or, at least, as best we can tell from the data we’re working with and how we’re working with it.
Causation is where marketers (and analysts) tend to make dangerous leaps between what a given data set can and cannot do. When it comes to making decisions, arguably, causation is key. We want to know, given a set of options when it comes to what we are going to do, which one will have the greatest positive effect? (See how “effect” worked its way in there? You know the phrase: “cause and effect.” Boom! There’s “cause!”)
This doesn’t mean that the only reason we use data is to find causation and make decisions, but it’s one of the main expectations we tend to have of the data.3
There is a perfectly valid use of data that does not have a reliance on causation. That use is simply measuring performance: how much traffic came to the website last month? How many leads have converted to opportunities this quarter? How many customers churned last year?
With a “causation first” focus, though, we can boil the subject of this post down to Gilligan’s Simplified Causal Evidence Ladder:TM
 THAT was the TL;DR! Let’s dive into each level of this “evidence ladder” (with a couple of important diversions along the way).
Level 1: Descriptive Statistics

Descriptive statistics are the bread and butter of the marketing analyst, and they live in the world of facts: facts about a given data set. It turns out that what a given data set represents can start to bend your brain a bit: is the data set representing a population, or is it representing a sample from a population? It…depends on your perspective!
Consider digital analytics data from last month. Descriptive statistics can describe a lot of facts:
- How much traffic came to the site
- The average (mean) traffic per day
- The total revenue of orders placed on the site
- To what extent traffic to the website and revenue from the website were correlated with each other
Putting aside the fact that website analytics data is inherently messy to collect, these “statistics” are all simply facts about the website’s performance last month.
If we are tasked with reporting the performance of the website, then last month’s data can be considered a population, and everything is nice and clean (and, I’m afraid, some will make the case that these are not actually descriptive statistics at all, but, rather, become parameters; technically, these folks are likely right, but we’re more concerned with the underlying concepts here).
In this scenario, there is nothing about “prediction” (we have the facts, there is no need to predict anything) or “causation” (we’re not asking “why?” We’re simply reporting).
What if, though, we consider the population to be “all past, present, and future traffic to the site?” In that case, the data from last month is simply a sample from the population. And, it is decidedly not a random sample, which means we need to proceed with extreme caution if we want to use last month’s data to make claims about this broader population.
If there was $2,000,000 of orders on the website last month, does that mean we can expect $2,000,000 this month? The answer is a big, fat “maybe.” We’re moving beyond descriptive statistics and need to move up our evidence ladder if we want to use that data to predict revenue for this month, much less explain what the drivers (“causal factors”) of revenue are.
An Important Off-the-Ladder Concept: Counterfactuals
The terminology starts to add some syllables when we move to Level 2 and Level 3, so let’s step off the ladder for a minute to hit one of those key terms: counterfactual. (Don’t worry, we’re only one rung off the ground at this point, so stepping off the ladder seems pretty safe.)
The basic idea of a counterfactual is that, if we had our druthers, and if we weren’t dealing with limitations in our ability to manipulate the space-time continuum, any time we had an important decision to make with multiple choices, we would make… all of them. We would split the universe, try a different option in each universe, see which one works out best, and then toss out the other universes and proceed with the choice (the decision!) that yielded the best results.
Say you are considering your overall investment in Google Adwords, and you’ve narrowed it down to three options:
- Continue with the same monthly spend you have been running with year-to-date
- Increase your monthly spend by 20% (and reduce your Paid Social spend by the same amount)
- Decrease your monthly spend by 20% (and increase your Paid Social spend accordingly)
Unfortunately, you can’t split the universe and try all three to see which one yields the greatest overall revenue for the organization, so you have to pick one of the above. The other two options are “counterfactuals”—the roads not taken.
This is where we step back onto our ladder, as Level 2 (Inferential Statistics) and Level 3 (Experimentation) are all about estimating the counterfactuals. In both cases, we’re attempting to get at causation, but we do so in very different ways.
Level 2: Inferential Statistics

This level is, arguably, the messiest. But, it’s also the most alluring, as it’s where the idea comes from that, given a sufficient volume of data fed into the right model, “the truth” will emerge. This is… not true. But, as “thought leaders” pontificate about “descriptive vs. predictive vs. prescriptive” analytics, there should be a link drawn to this level of the ladder.
Inferential statistics4 is all about taking a big pile of data that has already been generated and drawing conclusions (inferences) about the way the world works. The techniques for doing this are so broad and so deep that the articles linked to at the beginning of this post split this level into multiple levels!
When we start to look at historically generated data through a counterfactual lens, we can start to see the data in two different ways:
- We did a bunch of things and observed the results (descriptive statistics), but
- What would have happened if we had done some different things (counterfactuals!)
If only we could go back to the beginning of last month, split the universe a bunch of different ways, adjust our Google Adwords and Paid Social spend three different ways, and then see which worked out the best, we would crush it.
But we can’t.
So, instead, we’re asked to simply look at the data we do have and try to infer relevant relationships. Basically look at the facts and try to establish the… counterfact(ual)s.
This is…hard.
We have to use statistical modeling to make informed opinions (inferences) as to the relationship between our Google Adwords spend, our Paid Social spend, and our overall results (revenue). Pretty quickly, we’ll likely decide we need to look at more data than just last month’s—can we get a year or two’s worth, maybe? Then, we set about trying to tease apart and account for as many things as we can think of (this is why “domain expertise” is so important for both the analyst and the data scientist).
There are many, many different approaches for this, and they can get quite complicated. Although, they can also start out quite simple! If done well, most of these approaches will make an attempt to quantify how much uncertainty there is in their estimates (we won’t be able to eliminate uncertainty until we’re able to do that universe-splitting trick described earlier).
If this all sounds quite messy, that’s because it is. Unfortunately, it’s messiness that, at least in marketing, there has been an aversion to accepting. My take is that this is because we thought that the arrival of “digital” to the world of marketing in the early aughts was going to give us “all the data,” and that would then lead us to “the truth.” Alas! It only gave us data for a single universe: the counterfactuals have continued to be spawned at an infinite pace with ’nary a single piece of data being collected for them!
Except…
Level 3: Experimentation

This is the golden rung of the evidence ladder: controlled experimentation is the closest we can get to gathering direct data for our counterfactuals and actually honing in on a cause-and-effect relationship between “things we do” and “the outcomes they produce” (“stimulus-response” is another way to put this; as is “the effect of an intervention”).
This level of the evidence ladder goes by many different names. A (likely incomplete) list:5
- Randomized Controlled Trials
- Field Experiments
- Clinical Trials
- A/B Testing
- Matched Market Testing
These are all the same thing6, and they work by simply…splitting the universe. Okay, not exactly employing divergence points and space-time continuum hacks into entirely parallel universes but, instead, by divvying up the universe into different groups and treating each group in a different way. Using the example of a simple A/B test on a website:
- A virtual coin gets flipped every time a new visitor comes to the site
- If the virtual coin comes up “heads,” the visitor gets experience A; if it comes up “tails,” they get experience B
- We track each visitor and retain whether they were a “heads” or a “tails” user, including what else they did during the remainder of the visit on the site.
After a couple of weeks, we stop the experiment, and we evaluate the group of visits that were “heads” and the group of visits that were “tails” with respect to our dependent variable(s) (conversion rate, revenue, revenue per visit, etc.).
The difference in the results can then be causally attributed to whatever the difference is between experience A and experience B. This is because we split our universe, so, as a group, the “heads” users and the “tails” users were statistically the same. There is some magic to why all this works that is both intuitively obvious and, for me at least, still mind-blowing to the point that I wound up with a short URL called http://bit.ly/random-magic to link to a simulator that illustrates how this works.
In a nutshell, though: controlled experimentation is both easier to understand AND the gold standard when it comes to getting close to quantifying actual causality!
The downside: well…it takes planning and design and has to actually be executed as an experiment.
Briefly Back to Level 2 for…Quasi-Experimentation
As it turns out, Level 2 (Inferential Statistics) can be considered quasi-experimentation. I’m not making this up, and I’m a bit torn when it comes to using the term, as it’s open to gross misinterpretation.
What quasi-experimentation is not is just a half-assed experiment:
“Yeah… I know I should’ve randomly assigned which DMAs received the media and which ones did not when I did my matched market test, but we really wanted the media to run in our top 5 largest markets, so we forced all of those into the treatment group and then randomized what was left.”
This is not a quasi-experiment. This is a half-assed experiment, for which the results will be incredibly suspect!
Rather, quasi-experimentation simply means that we’re doing our best to create the conditions and results that we would have gotten from a true controlled experiment…without actually running an experiment. This is hard (remember, we said that Level 2 is messy), but it’s where techniques such as two-stage least squares regression (2SLS), diff-in-diff, Bayesian time-series modeling, instrumental variables, and many other techniques fall. They’re all, under the hood, trying to estimate counterfactuals, which, by now, we realize is at the root of causal inference, which, in turn, is at the root of making data-informed decisions!
To Summarize…
We took all sorts of simplifying shortcuts here, but the key concepts I hope you leave with are:
- Descriptive statistics are great for simply reporting facts about a set of data. When we’re “reporting performance,” they are fantastic. As soon as someone sees those results and asks, “Yes, jolly good. But… why?” then we have to move up the evidence ladder.
- Any given data set may be considered to be “the entire population” or a “sample from the population.” If it’s truly the latter, then we need to not treat it as though it’s the former.
- Inferential statistics is one term for a broad and deep set of techniques for using historically observed data to estimate how things would play out in parallel universes (aka, counterfactuals); inferential statistics and quasi-experimentation go hand-in-hand.
- Controlled experiments remove the “quasi” and actually get closer to actually observing counterfactuals.
Pitfalls abound, but, hopefully, this has provided a little bit of clarity when it comes to different approaches and applications of data.
I’m not looking to start any trouble here. Both posts have 4 levels, but the nc233 one has a “top” level that is omitted from the Shopify ladder, and the Shopify post has a “bottom” level that is not part of the nc233 one. This post you’re reading now attempts to simplify the ladder to three levels, and if the authors of either post–or anyone, for that matter–would like to eviscerate my simplification, let me go ahead and say it, “You’re right. I’m wrong. Please let this footnote suffice as my admission of such rather than insisting that I update this post to add the clarifications you would like to see.” I do hope to get comments enabled on this site at some point so that you can weigh in here directly. (And a gratuitous hat tip to Benn Stancil for reminding me, through his Substack, how much fun footnotes can be. And a further hat tip to you, dear reader, for reading the footnotes.)↩︎
Clearly, TL;DR is not my forte, given how far into the post we already were before I even tried to declare it.↩︎
I absolutely loathe the phrase “actionable insights,” as it gets tossed around with a frequency and reckless abandon that rivals the consumption of frankfurters on Dollar Dog Night at the ballpark. I’m coming to believe that my reaction to the phrase is because I’ve actually had the correct intuition as to what different reports and analyses could (and could not) reasonably deliver. The phrase implies that there is actionability (a decision can be made) based on an insight…which means there is an underlying causal finding. And, as this post tries to point out: those do not come from mere descriptive statistics.↩︎
Is “inferential statistics” the right term for this? I’m not entirely sure (but I’m getting increasingly comfortable with uncertainty). It’s the broadest term I’ve found for what is described for this level.↩︎
I’m going to go ahead and put “natural experiments” on this level, too, but just in a footnote rather than in the main list. In a nutshell, a natural experiment is a case where there just happened to be something that caused randomization of “treatment,” so the analyst or researcher wound up having an as-if-it-was-designed-as-a-controlled experiment land in their lap. Natural experiments require a bit of luck, a lot of diligence to ensure they truly meet the requirements, and, often, some extra data crunching because they’ll still just be a bit messier than a formally designed experiment.↩︎
If you’re determined to tell me that these are not the same thing…please see footnote #1 above.↩︎